A Practical Guide to Scanning and Transmission Electron Microscopy Simulations
Contents
Interactive CTF lineplot
%matplotlib widget
import numpy as np
import abtem

from matplotlib import cm, colors as mcolors, pyplot as plt
import numpy as np
from mpl_toolkits.axes_grid1 import make_axes_locatable
from colorspacious import cspace_convert

from IPython.display import display
import ipywidgets
Cs = -20e-6 * 1e10 # 20 micrometers
ene = 80e3
ctf = abtem.CTF(Cs=Cs, energy=ene, defocus="scherzer")
aberration_coefficients = {"C10": -ctf.defocus, "C30": Cs}
ctf = abtem.CTF(aberration_coefficients=aberration_coefficients, energy=ctf.energy)
ctf.semiangle_cutoff = ctf.crossover_angle
Cc = 1.2e-3 * 1e10
energy_spread = 0.35
focal_spread = Cc * energy_spread / ene
ctf.focal_spread = focal_spread
ctf.angular_spread = 1
dpi = 72
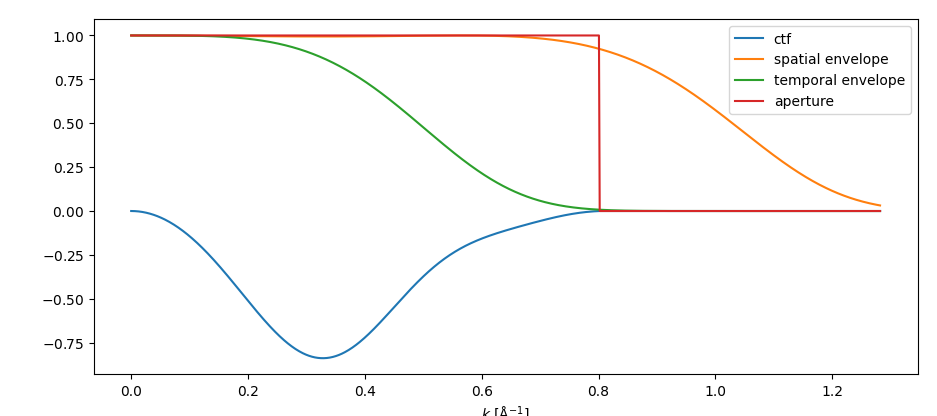
ctf.profiles().show(legend=True, figsize=(675/dpi, 300/dpi))
#plt.savefig('../static/ctf_line.png', dpi=600)<abtem.visualize.visualizations.Visualization at 0x146f4a5d0>
# widget figure generation
with plt.ioff():
    dpi = 72
    fig, ax = plt.subplots(1,1, figsize=(675/dpi, 300/dpi), dpi=dpi)

visualization = ctf.profiles(max_angle=60).show(units='mrad', ax=ax)

ax.set_title("Contrast transfer function")

fig.tight_layout()

fig.canvas.resizable = False
fig.canvas.header_visible = False
fig.canvas.footer_visible = False
fig.canvas.toolbar_visible = True
fig.canvas.layout.width = '675px'
fig.canvas.layout.height = '450px'
fig.canvas.toolbar_position = 'bottom'
def update_ctf(energy, defocus, C30, cutoff, temporal, spatial):
ax.cla()
ctf = abtem.CTF(
energy=energy*1e3,
semiangle_cutoff = cutoff,
defocus = defocus,
C30 = C30*1e7,
)
ctf.focal_spread = temporal
ctf.angular_spread = spatial
visualization = ctf.profiles(max_angle=50).show(units='mrad', ax=ax, legend=True)
fig.canvas.draw_idle()
return Nonestyle = {
'description_width': 'initial',
}
energy = ipywidgets.FloatSlider(
value=80, min=40, max=300,
step=5,
description = "Energy (kV)",
style = style,
)
defocus = ipywidgets.FloatSlider(
value = ctf.defocus, min = -200, max = -10,
step = 10,
description = "defocus / -C1 (A)",
style = style
)
C30 = ipywidgets.FloatSlider(
value = -20e-3, min = -40e-3, max =0,
step = 1e-3,
description = "C3 (mm)",
style = style
)
cutoff = ipywidgets.FloatSlider(
value = ctf.crossover_angle, min = 0, max = 100,
step = 1,
description = "Aperture cutoff (mrad)",
style = style
)
temporal = ipywidgets.FloatSlider(
value = ctf.focal_spread, min = 0, max = 100,
step = 1,
description = "Focal spread (A)",
style = style
)
spatial = ipywidgets.FloatSlider(
value = ctf.angular_spread, min = 0, max = 10,
step = 1,
description = "Angular spread (mrad)",
style = style
)
ipywidgets.interactive_output(
update_ctf,
{
'energy':energy,
'defocus':defocus,
'C30':C30,
'cutoff':cutoff,
'temporal':temporal,
'spatial':spatial
},
)
Nonewidget = ipywidgets.VBox(
[
fig.canvas,
ipywidgets.HBox([
ipywidgets.VBox([
energy,
defocus,
C30,
cutoff,
temporal,
spatial
]),
]),
],
)
display(widget);VBox(children=(Canvas(footer_visible=False, header_visible=False, layout=Layout(height='450px', width='675px')…
