A Practical Guide to Scanning and Transmission Electron Microscopy Simulations
Contents
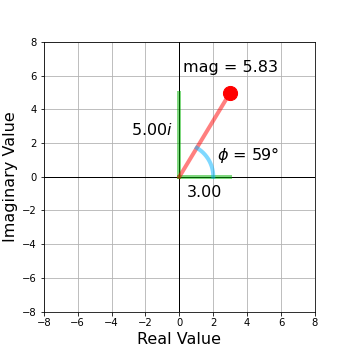
Complex Numbers Example
%matplotlib widget

import numpy as np
import matplotlib.pyplot as plt
# static figure
bound = 8
lw = 4
x,y = 3.0, 5.0
with plt.ioff():
dpi = 72
fig, ax = plt.subplots(figsize=(350/dpi, 350/dpi), dpi=dpi)
ax.plot(
(-bound,bound),
(0,0),
lw = 1,
c = (0,0,0),
)
ax.plot(
(0,0),
(-bound,bound),
lw = 1,
c = (0,0,0),
)
# plot user-specified value
ax.plot(
(0,x),
(0,0),
lw = lw,
c = (0, 0.7, 0, 0.5),
)
ax.plot(
(0,0),
(0,y),
lw = lw,
c = (0, 0.7, 0, 0.5),
)
ax.plot(
(0,x),
(0,y),
lw = lw,
c = (1, 0, 0, 0.5),
)
ax.scatter(
x,
y,
marker='o',
s=200,
color=(1,0,0),
)
# angular spread
r = (x+y)/2.0
t_max = np.arctan2(y,x)
t = np.linspace(0,t_max,181)
xa = 0.5 * r * np.cos(t)
ya = 0.5 * r * np.sin(t)
ax.plot(
xa,
ya,
lw = lw,
c = (0, 0.7, 1, 0.5),
)
# text labels
ax.text(
xa[90]+0.5,
ya[90],
r'$\phi$ = ' +
f'{np.rad2deg(t_max):.0f}' +
r'$\degree$',
fontsize = 16,
)
ax.text(
x*0.5,
-1.2,
f'{x:.2f}',
fontsize = 16,
horizontalalignment='center',
)
ax.text(
-0.4,
y*0.5,
f'{y:.2f}' + r'$\it{i}$',
fontsize = 16,
horizontalalignment='right',
)
ax.text(
x,
y+1.2,
'mag = ' +
f'{np.sqrt(x**2+y**2):.2f}',
fontsize = 16,
horizontalalignment='center',
)
ax.set_xlim((-bound,bound))
ax.set_ylim((-bound,bound))
ax.set_xlabel(
'Real Value',
fontsize = 16,
)
ax.set_ylabel(
'Imaginary Value',
fontsize = 16,
)
ax.grid()
fig.canvas.resizable = False
fig.canvas.header_visible = False
fig.canvas.footer_visible = False
fig.canvas.toolbar_visible = True
fig.canvas.layout.width = '400px'
fig.canvas.layout.height = '360px'
fig.canvas.toolbar_position = 'right'
fig.canvas

