A Practical Guide to Scanning and Transmission Electron Microscopy Simulations
Contents
Atomic potentials
%matplotlib ipympl

import matplotlib.pyplot as plt
import numpy as np

import abtem
from ase import Atoms

from abtem.core import config
config.set({"visualize.continuous_update": True});
Parametrized potentials
symbols = ["C", "N", "Si", "Au", "U"]

parametrization = abtem.parametrizations.LobatoParametrization()

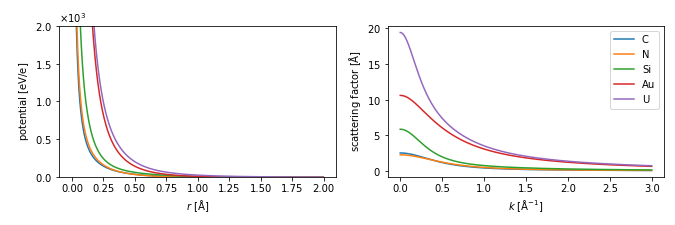
potentials = parametrization.line_profiles(symbols, cutoff=2, name="potential")
scattering_factor = parametrization.line_profiles(
    symbols, cutoff=3, name="scattering_factor"
)

dpi = 72
fig, (ax1, ax2) = plt.subplots(1, 2, figsize=(675/dpi, 225/dpi), dpi=dpi)

visualization = potentials.show(ax=ax1)
visualization.set_ylim([0, 2e3])

scattering_factor.show(legend=True, ax=ax2)

fig.canvas.resizable = False
fig.canvas.header_visible = False
fig.canvas.footer_visible = False
fig.canvas.toolbar_visible = True
fig.canvas.layout.width = '675px'
fig.canvas.layout.height = '250px'
fig.canvas.toolbar_position = 'bottom'

fig.tight_layout();
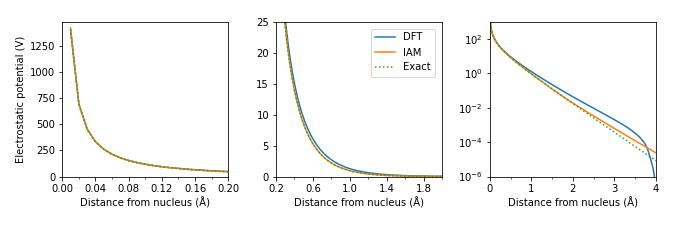
Comparison of potentials for H atom
from ase import Atoms
from ase.units import Bohr
from numpy import pi, exp

q = 1.602176*10**-19; # Coulomb constant
eps0 = 8.854188*10**-12; # Dielectric constant
# Size of the unit cell (Ångstrom)
a = 8.0
# Defining a single H atom at the corner of the cell.
atoms = Atoms('H', positions=[(0,0,0)], cell=(a, a, a))# Loading a radial line profile calculated for this atom with GPAW.
line_dft = np.load('data/H_atom_radial_potential_DFT.npy')# Exact solution of the electrostatic potential of hydrogen converted to Ångström.
r = np.linspace(0, atoms.cell[0,0], line_dft.shape[0]) # Radial grid to match the DFT
y = q / (4 * pi * eps0) * (exp(-2 * r / Bohr) / r + exp(-2 * r / Bohr) / Bohr) * 1e10;/var/folders/yv/3_fvvfd97_9f0_xdt_0k38zh0000gn/T/ipykernel_26925/4172123578.py:4: RuntimeWarning: divide by zero encountered in divide
y = q / (4 * pi * eps0) * (exp(-2 * r / Bohr) / r + exp(-2 * r / Bohr) / Bohr) * 1e10;
# Loading the Kirkland IAM potential from abTEM.
parametrization = abtem.parametrizations.KirklandParametrization()
potential = parametrization.potential('H')
line_iam = potential(r) # Radial potential matching given grid.
import matplotlib.pyplot as plt
from matplotlib.ticker import (MultipleLocator, AutoMinorLocator)
# Plotting the comparison between the three models.
fig, (ax1, ax2, ax3) = plt.subplots(1, 3, figsize=(675/dpi, 225/dpi), dpi=dpi)
ax1.set_xlim((0.0,0.2));
ax1.set_ylim((0,y[1]*1.05));
ax1.plot(r[1:], line_dft[1:], label='DFT')
ax1.plot(r[1:], line_iam[1:], label='IAM')
ax1.plot(r[1:], y[1:], label='Exact', linestyle=':');
ax1.set_xlabel('Distance from nucleus (Å)')
ax1.set_ylabel('Electrostatic potential (V)')
ax1.set_xticks(np.arange(0,0.24,0.04))
ax1.xaxis.set_minor_locator(MultipleLocator(0.02))
ax2.set_xlim((0.2,2.0));
ax2.set_ylim((0.0,25.0));
ax2.plot(r[1:], line_dft[1:])#, label='DFT')
ax2.plot(r[1:], line_iam[1:])#, label='IAM')
ax2.plot(r[1:], y[1:], linestyle=':')#, label='Exact');
ax2.set_xlabel('Distance from nucleus (Å)')
ax2.set_xticks(np.arange(0.2,2.2,0.4))
ax2.xaxis.set_minor_locator(MultipleLocator(0.2))
ax3.set_xlim((0.0,4.0));
ax3.set_ylim((0.000001,1000));
ax3.plot(r[1:], line_dft[1:])#, label='DFT')
ax3.plot(r[1:], line_iam[1:])#, label='IAM')
ax3.plot(r[1:], y[1:], linestyle=':')#, label='Exact');
ax3.set_yscale('log')
ax3.set_xlabel('Distance from nucleus (Å)')
ax3.xaxis.set_minor_locator(MultipleLocator(0.5))
fig.legend(loc=(0.55,0.66));
fig.canvas.resizable = False
fig.canvas.header_visible = False
fig.canvas.footer_visible = False
fig.canvas.toolbar_visible = True
fig.canvas.layout.width = '675px'
fig.canvas.layout.height = '250px'
fig.canvas.toolbar_position = 'bottom'
fig.tight_layout(pad=1.6)
H2 molecule
# Pre-calculates the DFT step for different H-H distances.
# Requires GPAW!

try:
    from gpaw import GPAW, FermiDirac, PW
    from ase import Atoms

    import numpy as np
    from abtem import Potential
    from abtem.potentials.gpaw import GPAWPotential

    a = 12.  # Size of unit cell (Angstrom)
    c = a / 2 # Center

    #Hydrogen molecule equilibrium bond length
    d = 0.75

    #Initialize empty lists to store the potentials.
    iampotentials = []
    dftpotentials = []
    ats = []

    #List of ten H-H separations to calculate.
    distances = np.arange(0.75,3.25,0.25)

    for i in np.arange(len(distances)):

       d = distances[i]

    #  Set up an two H atoms at a distance d.
       atoms = Atoms('H2',
                     positions=([c / 2, c - d / 2, c],
                                [c / 2, c + d / 2, c]),
                     cell=(a/2, a, a))
       ats.append(atoms)
    #  Define a GPAW LCAO calculator.
       calc = GPAW(mode=PW(800),
                   h=0.15,
                   #mode='lcao',
                   basis='dzp',
                   xc='PBE',
                   occupations=FermiDirac(0.0, fixmagmom=True),
                   txt=None
                   )

       atoms.calc = calc
       atoms.get_potential_energy()

    #  Prebuild and save the IAM and DFT potentials.
       iampotentials.append(Potential(atoms, projection='finite', sampling = 0.05).build())
       dftpotentials.append(GPAWPotential(calc, sampling = 0.05).build())

    iamstack = abtem.stack(iampotentials, list(distances.astype(str)))
    dftstack = abtem.stack(dftpotentials, list(distances.astype(str)))

    iamstack.to_zarr('data/H2_IAM_dists.zarr');
    dftstack.to_zarr('data/H2_DFT_dists.zarr');

except:
    print("Cannot import GPAW. Please use precalculated .zarr files.")
Cannot import GPAW. Please use precalculated .zarr files.
import abtem
iamstack = abtem.from_zarr('data/H2_IAM_dists.zarr').project()
dftstack = abtem.from_zarr('data/H2_DFT_dists.zarr').project()

diffstack = (iamstack-dftstack)
vis = diffstack.show(cbar=True, figsize=(4.5,5), interact=True, power=0.5, vmin=0);
#plt.savefig("../static/dft_iam_diff.png")[########################################] | 100% Completed | 106.10 ms
ImageGUI(children=(VBox(children=(SelectionSlider(options=('0.75', '1.0', '1.25', '1.5', '1.75', '2.0', '2.25'…
