Deep Learning Applications in Microscopy: Segmentation and Tracking
Contents
Select 'Train' or 'Test' to interact with dataset
%matplotlib widget
import os
import matplotlib.pyplot as plt
from matplotlib.widgets import Slider
import cv2
from pathlib import Path
from ipywidgets import HBox, ToggleButtons, VBox
# Dataset paths
train_dataset_path = Path('./dataset/train/')
test_dataset_path = Path('./dataset/test/')
# Load images and labels from the dataset
def load_images_and_labels(dataset_path):
image_dir = dataset_path / 'images'
label_dir = dataset_path / 'labels'
image_files = sorted(list(image_dir.glob('*.png')))
label_files = sorted(list(label_dir.glob('*.png')))
images = [cv2.imread(str(img), cv2.IMREAD_GRAYSCALE) for img in image_files]
labels = [cv2.imread(str(lbl), cv2.IMREAD_GRAYSCALE) for lbl in label_files]
return images, labels
# Load train and test datasets
train_images, train_labels = load_images_and_labels(train_dataset_path)
test_images, test_labels = load_images_and_labels(test_dataset_path)
# Set initial dataset to train
images, labels = train_images, train_labels
# Visualization setup
fig, ax = plt.subplots(1, 2, figsize=(6.7,3.5))
plt.subplots_adjust(left=0.05, bottom=0.20)
fig.canvas.resizable = False
fig.canvas.header_visible = False
fig.canvas.footer_visible = False
fig.canvas.toolbar_visible = True
fig.canvas.layout.width = '670px'
fig.canvas.layout.height = "360px"
fig.canvas.toolbar_position = 'bottom'
# Initialize with the first image
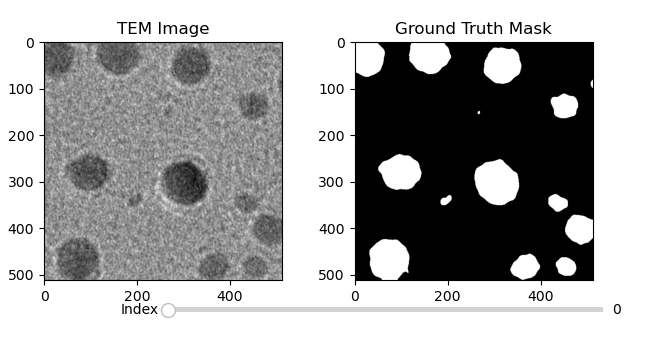
image_display = ax[0].imshow(images[0], cmap='gray')
label_display = ax[1].imshow(labels[0], cmap='gray')
# Set titles
ax[0].set_title('TEM Image')
ax[1].set_title('Ground Truth Mask')
# Current image index
current_index = 0
# Sync zoom and pan between subplots
def on_zoom(event):
if int(slider.val) == current_index: # Sync only if index matches
xlim_0, ylim_0 = ax[0].get_xlim(), ax[0].get_ylim()
ax[1].set_xlim(xlim_0)
ax[1].set_ylim(ylim_0)
fig.canvas.draw_idle()
# Connect the zoom/pan sync event
fig.canvas.mpl_connect('motion_notify_event', on_zoom)
# Slider setup
ax_slider = plt.axes([0.25, 0.1, 0.65, 0.03], facecolor='lightgoldenrodyellow')
slider = Slider(ax_slider, 'Index', 0, len(images) - 1, valinit=0, valstep=1)
# Slider update function
def update(val):
global current_index
idx = int(slider.val)
if idx != current_index: # Reset view on image change
image_display.set_data(images[idx])
label_display.set_data(labels[idx])
ax[0].set_xlim(0, images[idx].shape[1])
ax[0].set_ylim(images[idx].shape[0], 0)
ax[1].set_xlim(0, labels[idx].shape[1])
ax[1].set_ylim(labels[idx].shape[0], 0)
current_index = idx
fig.canvas.draw_idle()
# Connect slider to update function
slider.on_changed(update)
# Toggle between train and test datasets
def update_dataset(change):
global images, labels
if toggle_buttons.value == 'Train':
images, labels = train_images, train_labels
else:
images, labels = test_images, test_labels
# Update slider range
slider.valmax = len(images) - 1
# Trigger update by forcing slider to refresh
slider.set_val(-1) # Force invalid value
slider.set_val(0) # Reset to 0
update(0) # Update displayed image
# Create dataset toggle buttons
toggle_buttons = ToggleButtons(
options=['Train', 'Test'],
description='Dataset:',
disabled=False,
button_style=''
)
# Connect toggle buttons to dataset switch function
toggle_buttons.observe(update_dataset, names='value')
# Display controls and images
controls = VBox([toggle_buttons])
display(HBox([controls]))
# Show the plot
plt.show()HBox(children=(VBox(children=(ToggleButtons(description='Dataset:', options=('Train', 'Test'), value='Train'),…