Deep Learning Applications in Microscopy: Segmentation and Tracking
Results
TEM Image Segmentation
Table 3.1:Model’s names, and resolutions, throughput, pixels per second, VRAM, test IoU, and test Dice Coefficient of models in this paper.
Model name | Resolution | Throughput | pixel/s | VRAM | Test IoU | Test Dice Coefficient |
|---|---|---|---|---|---|---|
YOLOv8n-seg | 512 | 80.19/s | 21021327/s | 1513MB | 0.93324 | 0.96546 |
Swin-UNet | 448 | 64.89/s | 13023682/s | 1793MB | 0.96495 | 0.98216 |
VMamba | 512 | 16.41/s | 4301783/s | 1823MB | 0.99449 | 0.99723 |
EfficientSAM-tiny | 1024 | 17.94/s | 18811453/s | 1827MB | 0.99672 | 0.99836 |
This paper compares four models, YOLOv8n-seg, EfficientSAM-tiny, Swin-UNet, and VMamba. The comparison is analyzed by comparing the accuracy, throughput, number of parameters, and video memory usage.
- YOLOv8n-seg provides a high throughput (80.19/s) with a relatively small number of parameters (3.41M) and video memory of 1513MB. This model, while performing well in terms of accuracy, can be seen in Figure 3.1 where overfitting occurs during the training of YOLO. Early stopping was used to mitigate this problem.
- Swin-UNet has the sliding window attention mechanism, the number of parameters (3.65M) and video memory usage 1793MB are moderate and the throughput (64.89/s) is high. Swin-UNet based on the sliding window mechanism has a significant advantage in training and inference speed.
- VMamba is based on a new architecture based on Mamba. It has a relatively small number of parameters (3.15M) and a video memory of 1823MB. However, its throughput (16.41/s) is low and its inferencing is slow. It is worth noting that Mamba, being a new architecture, is currently not able to train with multiple cards, unlike the other models.
- EfficientSAM-tiny has a high number of parameters (10.19M) and video memory usage 1827MB, relatively low throughput (17.94/s), but has a significant advantage in accuracy. Despite its high number of parameters, it was the final model chosen due to its excellent accuracy.
VBox(children=(ToggleButtons(description='Y-Axis Scale:', options=('Linear', 'Log'), tooltip='Toggle log scali…
Figure 3.1:The top row of graphs shows detailed zoomed sections of the full range loss curves displayed in the bottom row for various segmentation models for comparison: YOLOv8n-seg, Swin-UNet, VMamba, and EfficientSAM.
The training and testing losses of four different segmentation models (YOLOv8n-seg, Swin-UNet, VMamba, and EfficientSAM) are comparatively analyzed in Figure 3.1. Figure 3.1 shows how the loss of each model varies over 1000 epochs. First, the training loss of the YOLOv8n-seg model gradually decreases and stabilizes, while the testing loss significantly increases after the initial fluctuation, indicating a certain degree of overfitting in this model. Second, the Swin-UNet model shows a more consistent downward trend in training and testing losses, and although the testing loss is slightly higher than the training loss, the overall curve tends to be stable, showing good generalization ability. Thirdly, the training and testing loss curves of the VMamba model are very close to each other and drop rapidly in a short period of time, after which they remain at a low level, indicating that it has a significant advantage in convergence speed and stability. Finally, the EfficientSAM model performs particularly well, as its training and testing losses almost completely overlap and are maintained at a very low level throughout the training process, showing extremely high training efficiency and excellent generalization performance.
HBox(children=(VBox(children=(Dropdown(description='Metric:', layout=Layout(width='200px'), options=('IoU', 'D…
Figure 3.2:Comparison of training and test IoU and Dice coefficients for different segmentation models: Swin-UNet, VMamba, and EfficientSAM.
Figure 3.2 shows the trend of training and testing Intersection over Union (IoU) and Dice-Sørensen coefficient (Dice Coefficient) with 1000 training epochs for three different segmentation models (Swin-UNet, VMamba, EfficientSAM). The training and testing IoU and Dice Coefficient curves for the YOLO model are not available here, but the final IoU and Dice Coefficient are shown in Table 3.1. For the Swin-UNet model, the training and testing IoU rises rapidly at the beginning of the training rounds, slows down at about round 400. 1000th round to reach an IoU value of about 0.965. The training and testing Dice Coefficient shows a similar trend and eventually stabilizes at about 0.982. Both the training and testing IoU and Dice Coefficient of the VMamba model show a rapid increase with slight fluctuations in the early stages of training. However, after about 300 rounds, these metrics stabilize rapidly and eventually reach about 0.994 and 0.997. This indicates that the VMamba model performs well both in terms of convergence speed and final performance. Notably, the EfficientSAM model performs significantly better than the other two models. Its training and testing IoUs as well as Dice Coefficient rapidly approach 1.0 early in training, which may be due to the use of a pre-trained model. These metrics did not fluctuate significantly during subsequent training, and quickly reached higher accuracy, eventually stabilizing at about 0.997 and 0.998.
HBox(children=(Button(description='Microscope Image', style=ButtonStyle()), Button(description='Ground Truth M…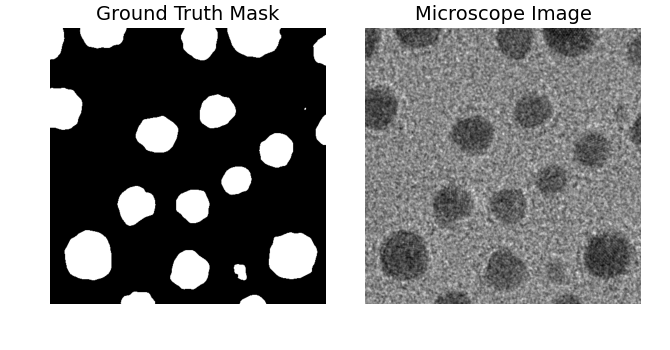
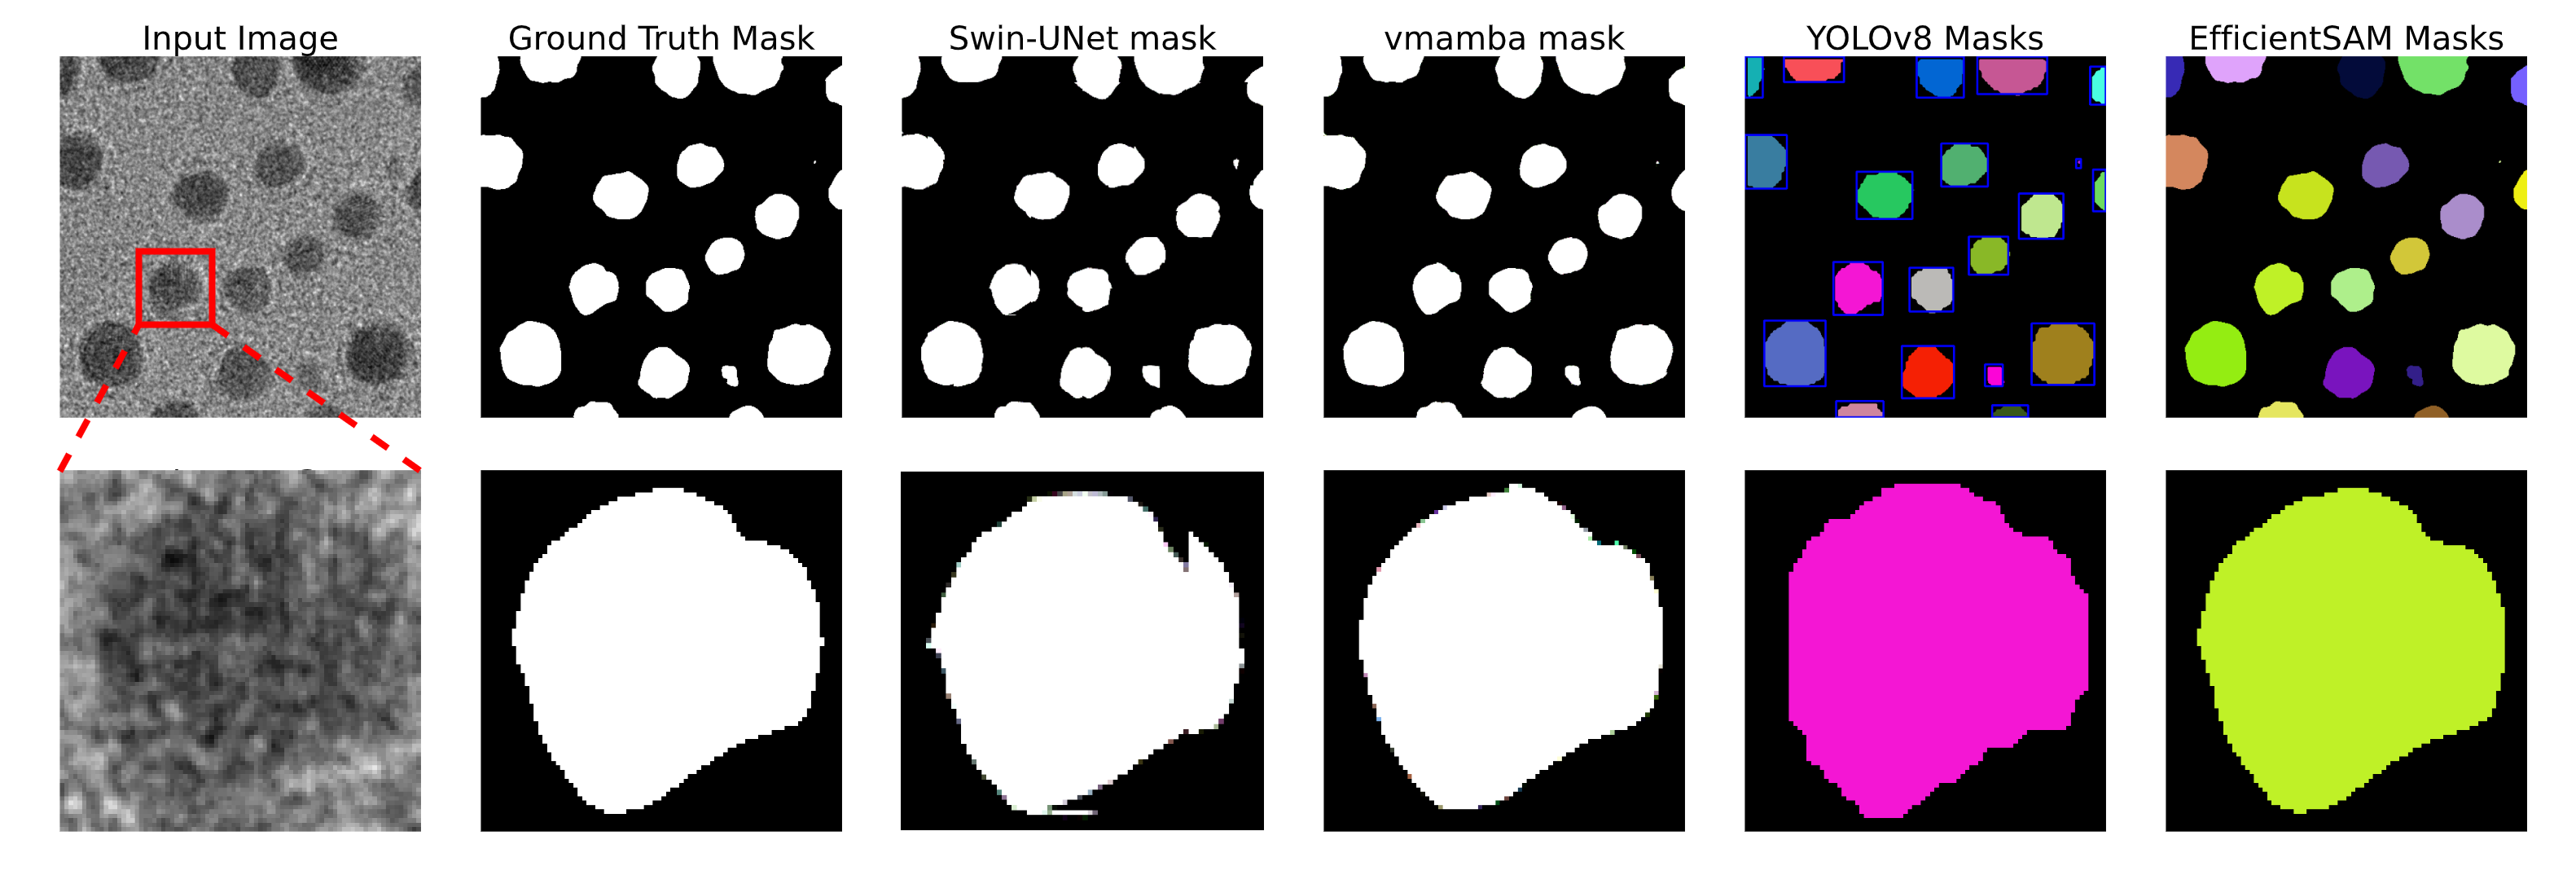
Figure 3.3:Comparison of different segmentation methods. Left: input image and zoomed-in area. Then, segmentation results of Ground Truth, Swin-UNet, VMamba, YOLOv8, and EfficientSAM.
The results of Mask comparison of different segmentation methods in detail are shown in Figure 3.3. Firstly, the input image and its magnified region are shown, followed by the segmentation results of “Ground Truth Mask”, Swin-UNet, VMamba, YOLOv8, and EfficientSAM in order. The “Ground Truth Mask” provides the ideal reference mask for comparing the performance of other methods.
The segmentation results of Swin-UNet show a slight lack of edge detail, with some regions failing to be segmented correctly, which is often unacceptable for scientific research. VMamba performs similarly to Swin-UNet, but with a smoother boundary treatment. YOLOv8’s segmentation results have multiple targets boxed and labeled, however, it does not perform as well as the previous two in terms of fine-grained segmentation. It is worth noting that YOLOv8 has a significant advantage in real-time detection and processing speed, which is especially suitable for application scenarios that require a fast response, but the accuracy of the recognition is more important than the speed in scientific research. EfficientSAM performs excellently in preserving the integrity of the target and has a clearer boundary. The EfficientSAM and YOLOv8-seg models segmentation can provide IDs (different colors correspond to different IDs). EfficientSAM can generate masks with IDs by calling the mask decoder multiple times with an array of point prompts, and YOLOv8-seg can also provide IDs because it is a target detection model that performs segmentation after single term of detection.
TEM Video Tracking
VBox(children=(HBox(children=(Play(value=0, interval=50, layout=Layout(width='110px'), max=719), IntSlider(val…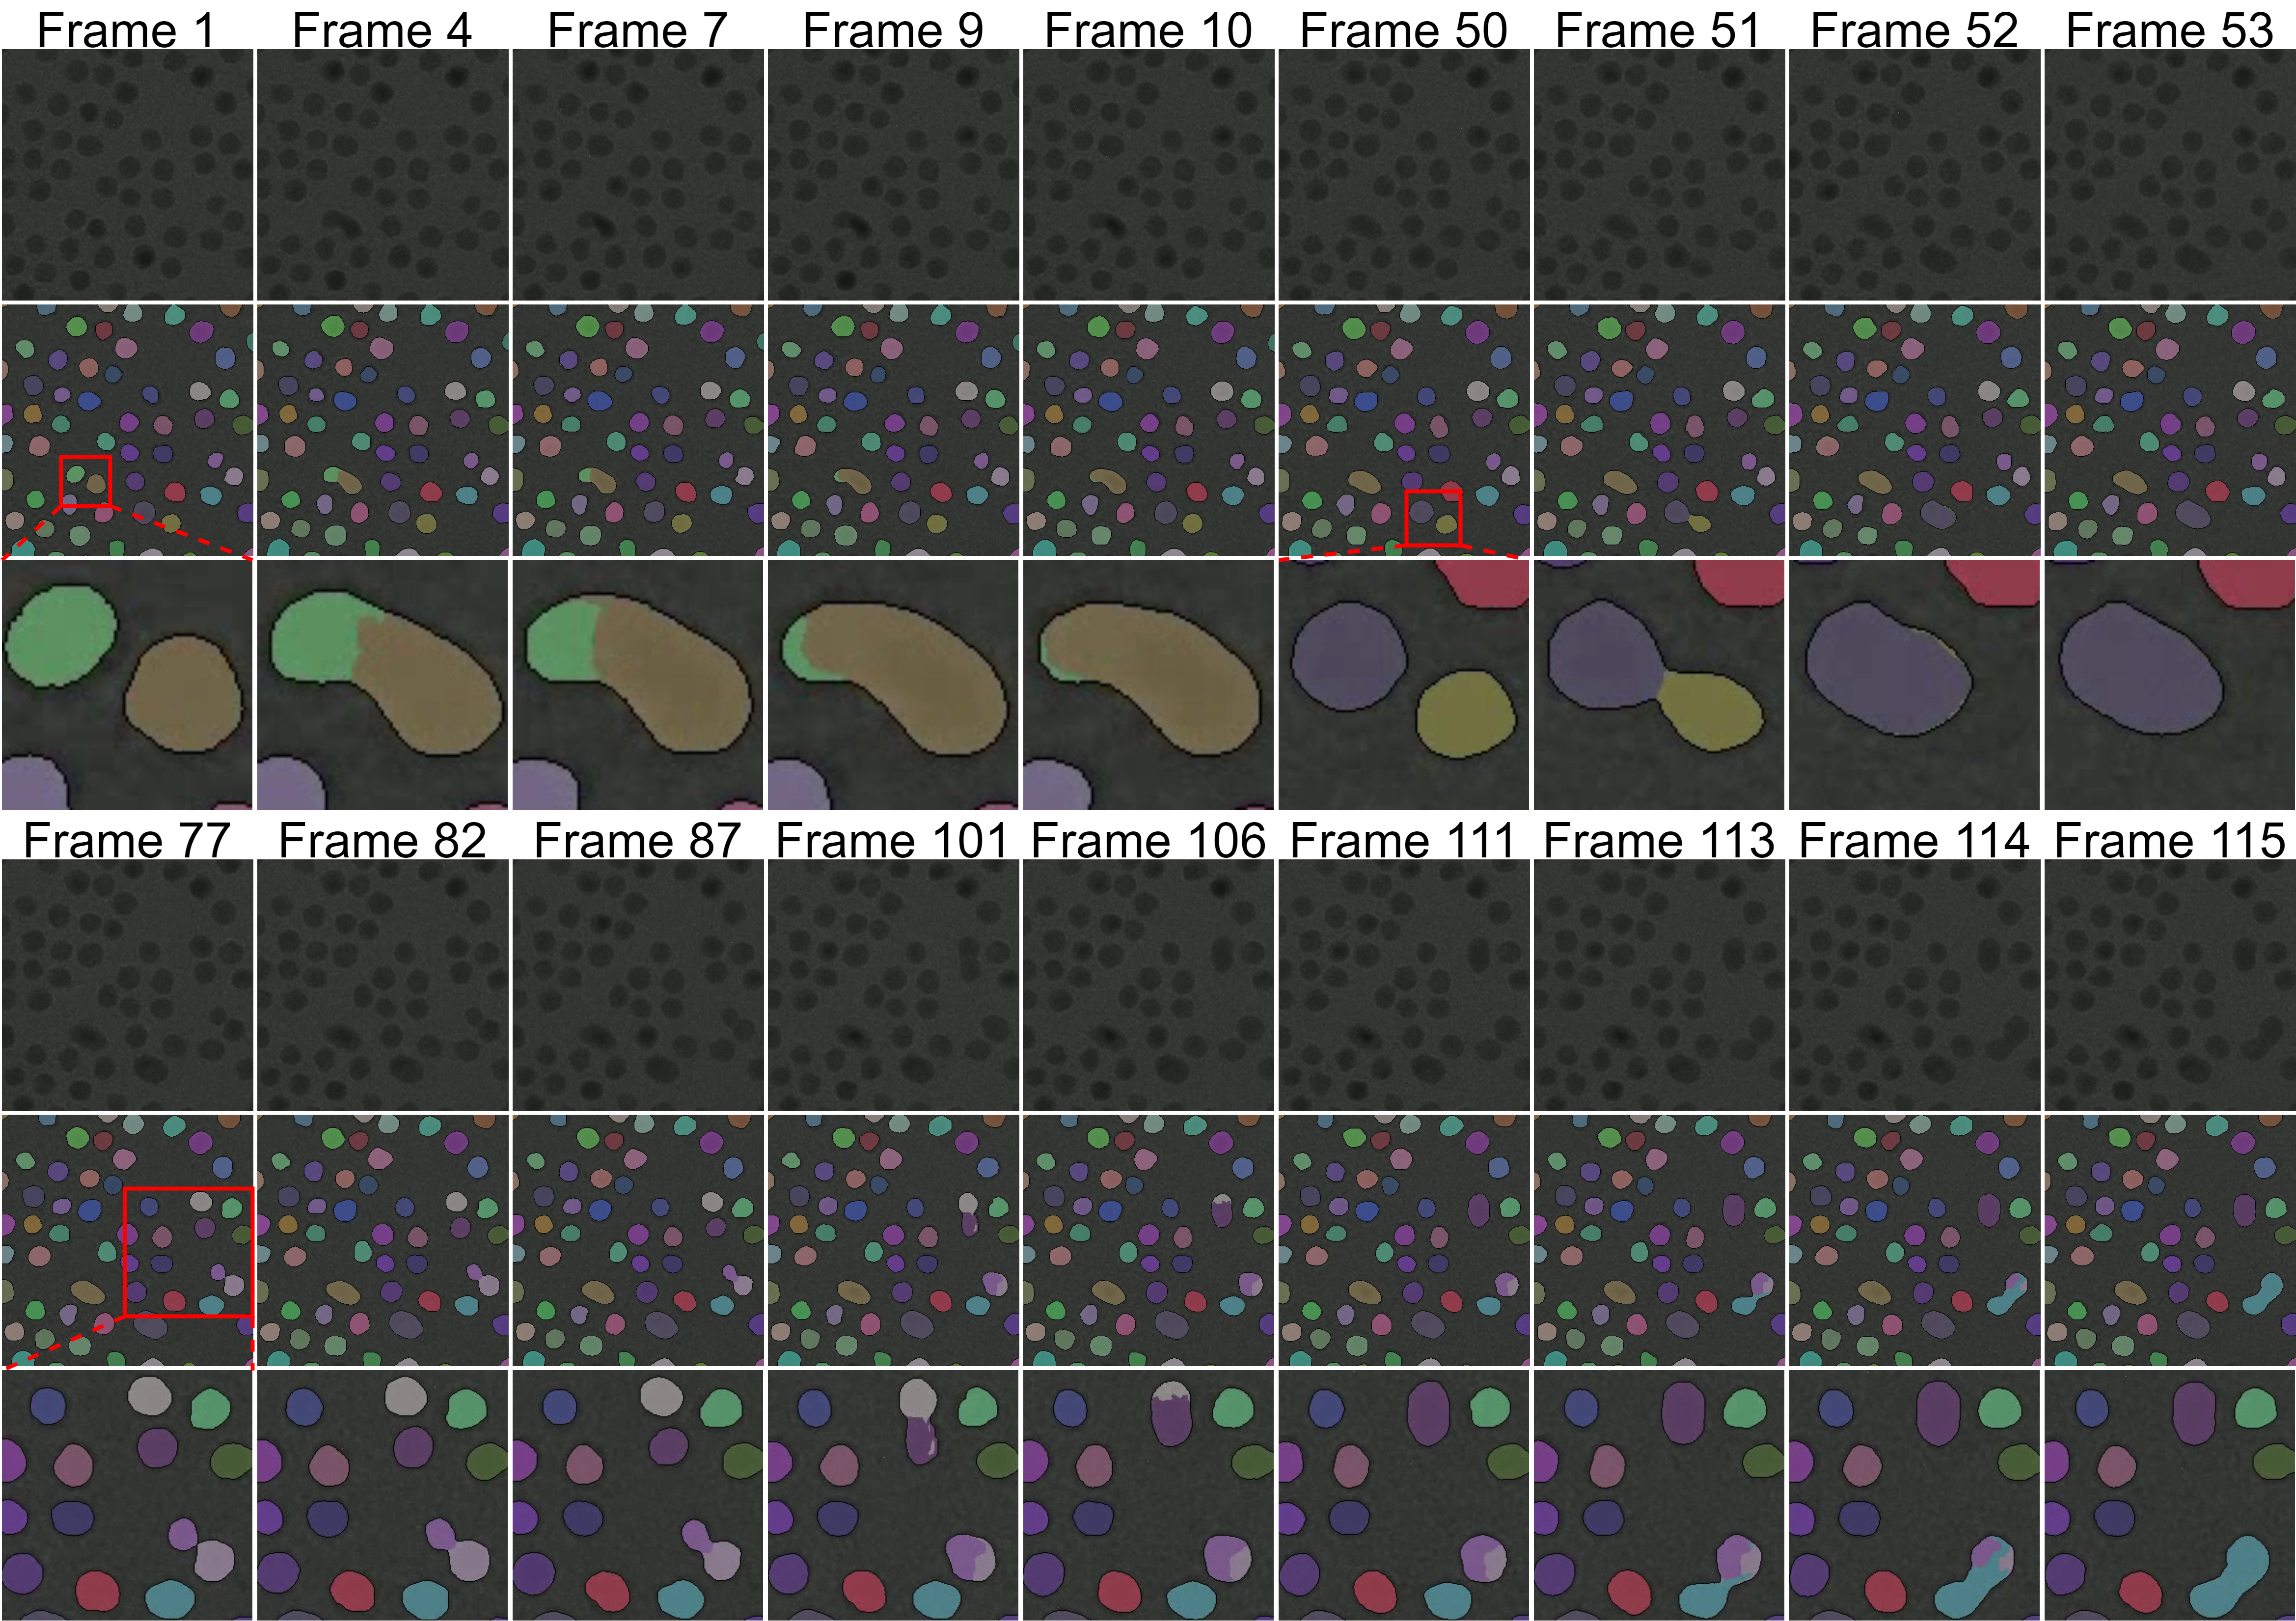
Figure 3.4:Comparison of key video frames. The first row shows original frames, the second row shows segmentation results, and the third row is a magnified view of the red box area, showing segmentation and tracking of objects.
In this paper, a video analysis of the sintering process of the material at a high temperature of 800℃ is carried out. Figure 3.4 shows the original images of the key frames and the segmentation results. The first row shows the original frames, showing the continuous image of some key frames 1-115. The second row shows the segmentation result from EfficientSAM, which shows the change of objects on the time axis by color marking different objects. The third row shows a magnified view of the red-framed area, in order to show the segmentation and tracking process more clearly. The images from frame 77-115 show the sintering phenomenon of multiple nano-particles, especially between frame 111-115, where the three nano-particles are gradually fused and show obvious morphological changes. This indicates that a significant sintering process occurred in the material at a high temperature of 800℃. Comparison of the segmentation results with the original frames shows that the method in this paper is able to accurately identify and label the objects, and track them effectively even when they become sintered. The color-marked segmentation results clearly show the dynamic changes of different particles during the sintering process, and track the evolution of the microstructure of the material under the high-temperature environment very well.

